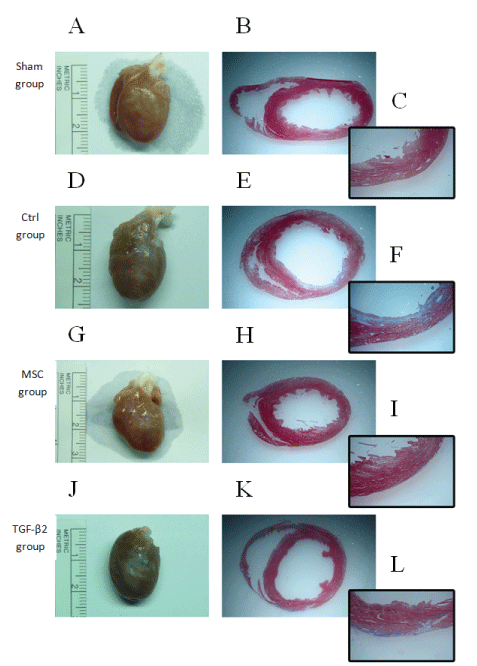
The gross morphology of heart and Masson’s Trichrome-stained heart tissue cross-sections 15 weeks after thoracotomy are shown. Red regions indicate normal myocardium; blue regions indicate fibrosis. Decreased myocardial fibrosis was found in MSC group and TGF-β2 group.
A-C: sham group. D-F: Ctrl group. G-I: MSC group. J-L: TGF-β2 group.
A, D, G, J: gross anatomy of heart. B, E, H, K: crosssections of heart tissue (40×). C, F, I, L: cross-sections of heart tissue (400×).